Kryptowährungspreise, Charts & Marktdaten
Verfolgen Sie Live-Preise, 24-Stunden-Bewegungen, Marktkapitalisierung und 7-Tage-Trends der Kryptowährungen, die wir beobachten — samt dem Kontext, um die Zahlen einzuordnen. Alle Werte stammen aggregiert von Marktdatenanbietern und werden nur angezeigt, wenn sie echt und aktuell sind.
Marktpuls
Live-Kryptowährungspreise
300 erfasste Coins| # ▲ | Coin | Kurs | 1h | 24h | 7d | Marktkapitalisierung | Letzte 7 T |
|---|---|---|---|---|---|---|---|
| 1 |
|
$59,665.00 | ▼0.31% | ▼0.61% | ▼7.63% | $1.20T | |
| 2 |
|
$1,571.32 | ▼0.11% | ▼0.49% | ▼10.83% | $189.56B | |
| 3 |
|
$0.9986 | ▼0.01% | ▼0.00% | ▼0.04% | $186.08B | |
| 4 |
|
$551.51 | ▼0.19% | ▼0.67% | ▼8.03% | $74.32B | |
| 5 |
|
$0.9998 | ▼0.00% | ▲0.01% | ▲0.01% | $73.74B | |
| 6 |
|
$1.05 | ▼0.43% | ▲0.30% | ▼8.75% | $65.55B | |
| 7 |
|
$73.45 | ▼0.18% | ▲2.26% | ▼0.93% | $42.70B | |
| 8 |
|
$0.3221 | ▲0.17% | ▼0.47% | ▼2.78% | $30.55B | |
| 9 |
|
$1.02 | ▲0.27% | ▲0.27% | ▲0.13% | $19.73B | |
| 10 |
|
$64.17 | ▲0.42% | ▲1.84% | ▼6.25% | $14.33B | |
| 11 |
|
$0.0727 | ▼0.66% | ▼1.17% | ▼13.91% | $11.26B | |
| 12 |
|
$0.9995 | ▼0.01% | ▼0.01% | ▼0.02% | $10.34B | |
| 13 |
|
$0.0155 | ▼0.06% | ▼0.17% | ▲7.74% | $10.27B | |
| 14 |
|
$9.39 | ▲0.00% | ▼0.36% | ▼1.42% | $8.65B | |
| 15 |
|
$381.06 | ▼0.69% | ▼1.10% | ▼16.49% | $6.40B | |
| 16 |
|
$0.1736 | ▼0.32% | ▲1.46% | ▼19.36% | $5.90B | |
| 17 |
|
$304.60 | ▼0.93% | ▼1.47% | ▼7.17% | $5.71B | |
| 18 |
|
$0.1456 | ▼0.29% | ▼3.96% | ▼3.31% | $5.67B | |
| 19 |
|
$47.99 | ▼0.40% | ▼0.10% | ▼9.80% | $5.67B | |
| 20 |
|
$0.1444 | ▼0.76% | ▲0.00% | ▼10.74% | $5.38B | |
| 21 |
|
$7.29 | ▼0.72% | ▲0.45% | ▼10.04% | $5.45B | |
| 22 |
|
$0.9997 | ▲0.05% | ▲0.03% | ▲0.01% | $4.65B | |
| 23 |
|
$0.9981 | ▼0.01% | ▼0.01% | ▼0.09% | $4.45B | |
| 24 |
|
$1.60 | ▲0.30% | ▲2.62% | ▼4.87% | $4.32B | |
| 25 |
|
$196.48 | ▼0.69% | ▲2.03% | ▼2.63% | $3.94B | |
| 26 |
|
$0.9997 | ▲0.01% | ▲0.00% | ▲0.02% | $4.63B | |
| 27 |
|
$15.50 | ▼2.30% | ▼9.40% | ▲2.79% | $4.84B | |
| 28 |
|
$0.5717 | ▼0.47% | ▼15.61% | ▼80.45% | $755.00M | |
| 29 |
|
$0.0712 | ▼0.23% | ▲0.00% | ▼11.24% | $3.10B | |
| 30 |
|
$42.54 | ▲0.07% | ▼1.20% | ▼6.45% | $3.29B | |
| 31 |
|
$0.6909 | ▼0.50% | ▲0.78% | ▼6.12% | $2.78B | |
| 32 |
|
$1.13 | ▲0.04% | ▲0.05% | ▲0.13% | $3.11B | |
| 33 |
|
$1.84 | ▼0.76% | ▼1.19% | ▼15.51% | $2.39B | |
| 34 |
|
$6.56 | ▼0.80% | ▲4.04% | ▲2.93% | $2.83B | |
| 35 |
|
$0.00000420 | ▼0.61% | ▲0.53% | ▼11.39% | $2.48B | |
| 36 |
|
$0.9999 | ▲0.03% | ▲0.00% | ▲0.01% | $2.97B | |
| 37 |
|
$1.00 | ▼0.01% | ▲0.04% | ▲0.00% | $2.74B | |
| 38 |
|
$0.0539 | ▼0.12% | ▼0.77% | ▼9.57% | $2.48B | |
| 39 |
|
$4,027.33 | ▼0.16% | ▼0.93% | ▼3.65% | $2.47B | |
| 40 |
|
$1.00 | ▲0.00% | ▲0.00% | ▲0.00% | $2.25B | |
| 41 |
|
$205.07 | ▼0.64% | ▼1.25% | ▼12.83% | $1.97B | |
| 42 |
|
$0.4258 | ▼0.72% | ▼4.39% | ▼33.01% | $1.49B | |
| 43 |
|
$1.14 | ▲0.40% | ▲0.07% | ▼0.33% | $2.16B | |
| 44 |
|
$2.95 | ▲0.11% | ▲0.61% | ▼3.64% | $1.83B | |
| 45 |
|
$0.0580 | ▼0.78% | ▲0.32% | ▼1.84% | $1.85B | |
| 46 |
|
$4,031.28 | ▼0.11% | ▼0.95% | ▼3.82% | $1.82B | |
| 47 |
|
$0.6290 | ▼0.27% | ▲1.64% | ▼2.01% | $1.69B | |
| 48 |
|
$0.4248 | ▼0.62% | ▲0.23% | ▼21.28% | $1.40B | |
| 49 |
|
$0.3115 | ▼0.65% | ▲0.47% | ▼8.50% | $1.52B | |
| 50 |
|
$0.8185 | ▼0.28% | ▲1.74% | ▼15.70% | $1.38B | |
| 51 |
|
$1.00 | ▲0.02% | ▲0.03% | ▲0.00% | $1.57B | |
| 52 |
|
$0.00000167 | ▼0.13% | ▼0.42% | ▼4.07% | $1.52B | |
| 53 |
|
$77.72 | ▼0.36% | ▼0.07% | ▲1.79% | $1.63B | |
| 54 |
|
$0.9946 | ▼0.06% | ▼0.03% | ▼0.08% | $1.42B | |
| 55 |
|
$0.1196 | ▲0.04% | ▼5.55% | ▼11.82% | $1.30B | |
| 56 |
|
$0.9988 | ▼0.02% | ▲0.01% | ▼0.01% | $1.36B | |
| 57 |
|
$0.0511 | ▲0.07% | ▲2.69% | ▼14.04% | $1.19B | |
| 58 |
|
$0.9983 | ▲0.00% | ▲0.01% | ▼0.05% | $1.32B | |
| 59 |
|
$2.16 | ▼0.38% | ▲0.88% | ▼5.68% | $1.20B | |
| 60 |
|
$1.62 | ▼0.19% | ▼0.76% | ▼8.09% | $1.14B | |
| 61 |
|
$1.80 | ▼0.63% | ▲2.60% | ▼2.38% | $1.17B | |
| 62 |
|
$0.00000235 | ▼0.71% | ▼1.36% | ▼18.78% | $986.97M | |
| 63 |
|
$7.08 | ▲0.10% | ▲0.72% | ▼3.58% | $1.11B | |
| 64 |
|
$91.90 | ▼0.76% | ▲2.90% | ▲19.87% | $1.40B | |
| 65 |
|
$65.58 | ▼0.88% | ▲0.03% | ▼7.09% | $953.72M | |
| 66 |
|
$0.9997 | ▲0.01% | ▲0.01% | ▼0.01% | $1.02B | |
| 67 |
|
$1.55 | ▼0.82% | ▼1.35% | ▼15.22% | $799.97M | |
| 68 |
|
$11.13 | ▲0.01% | ▲0.01% | ▲0.08% | $760.34M | |
| 69 |
|
$106.97 | ▲0.00% | ▼0.06% | ▼0.09% | $974.72M | |
| 70 |
|
$6.79 | ▲0.43% | ▲0.69% | ▼6.47% | $915.48M | |
| 71 |
|
$1.20 | ▼0.00% | ▲0.11% | ▼0.50% | $940.80M | |
| 72 |
|
$0.9999 | ▲0.02% | ▲0.03% | ▲0.03% | $736.07M | |
| 73 |
|
$1.56 | ▼0.25% | ▲0.62% | ▼8.79% | $807.61M | |
| 74 |
|
$1.11 | ▲0.00% | ▲0.03% | ▲0.06% | $870.19M | |
| 75 |
|
$0.0870 | ▼0.87% | ▲1.16% | ▼4.99% | $777.43M | |
| 76 |
|
$0.0283 | ▼0.14% | ▲2.12% | ▼6.61% | $778.07M | |
| 77 |
|
$0.0813 | ▲0.68% | ▲7.61% | ▼16.22% | $755.43M | |
| 78 |
|
$0.7181 | ▼0.68% | ▲0.56% | ▼9.88% | $718.23M | |
| 79 |
|
$0.0714 | ▼0.44% | ▲0.28% | ▼10.63% | $762.26M | |
| 80 |
|
$0.0380 | ▲1.32% | ▲1.41% | ▲8.22% | $913.88M | |
| 81 |
|
$13.03 | ▼1.63% | ▼4.28% | ▼18.64% | $613.84M | |
| 82 |
|
$6.51 | ▲0.46% | ▼0.78% | ▼4.75% | $692.82M | |
| 83 |
|
$0.0873 | ▲0.05% | ▼1.54% | ▲4.68% | $745.84M | |
| 84 |
|
$21.78 | ▲0.29% | ▼2.46% | ▲24.63% | $1.02B | |
| 85 |
|
$1.04 | ▲0.00% | ▲0.04% | ▲0.04% | $681.83M | |
| 86 |
|
$0.7040 | ▼0.91% | ▼1.54% | ▲0.12% | $704.23M | |
| 87 |
|
$0.00656923 | ▼0.64% | ▼1.93% | ▼11.67% | $569.03M | |
| 88 |
|
$0.7173 | ▼0.87% | ▼0.81% | ▼11.48% | $568.81M | |
| 89 |
|
$0.2149 | ▼0.90% | ▼0.04% | ▲1.31% | $713.64M | |
| 90 |
|
$0.0877 | ▲0.74% | ▲4.13% | ▲7.40% | $678.90M | |
| 91 |
|
$0.9977 | ▼0.01% | ▼0.02% | ▼0.07% | $597.61M | |
| 92 |
|
$0.0278 | ▲0.10% | ▲0.07% | ▼4.99% | $554.77M | |
| 93 |
|
$0.9997 | ▼0.00% | ▲0.01% | ▼0.01% | $561.46M | |
| 94 |
|
$0.5776 | ▼1.05% | ▼1.20% | ▼15.13% | $480.86M | |
| 95 |
|
$0.9985 | ▲0.01% | ▲0.00% | ▼0.04% | $552.75M | |
| 96 |
|
$1.15 | ▼0.01% | ▲0.12% | ▼0.46% | $612.87M | |
| 97 |
|
$4.70 | ▲0.32% | ▲0.96% | ▼5.44% | $470.27M | |
| 98 |
|
$0.0753 | ▼1.15% | ▲2.01% | ▼12.48% | $479.11M | |
| 99 |
|
$0.0123 | ▲0.20% | ▲0.52% | ▼5.14% | $482.89M | |
| 100 |
|
$0.00139127 | ▼1.11% | ▼7.13% | ▼8.39% | $565.34M | |
| 101 |
|
$0.9995 | ▼0.02% | ▼0.00% | ▲0.02% | $505.44M | |
| 102 |
|
$0.0312 | ▼0.65% | ▲2.92% | ▼4.97% | $518.62M | |
| 103 |
|
$0.9977 | ▲0.04% | ▲0.04% | ▼0.07% | $493.39M | |
| 104 |
|
$5.09 | ▲1.09% | ▲2.80% | ▲19.77% | $638.36M | |
| 105 |
|
$115.70 | ▲0.00% | ▲0.00% | ▲0.08% | $407.01M | |
| 106 |
|
$2.73 | ▲2.09% | ▲7.94% | ▲61.66% | $784.01M | |
| 107 |
|
$32.75 | ▼0.73% | ▲1.81% | ▼7.25% | $417.69M | |
| 108 |
|
$0.00860790 | ▼1.04% | ▼11.14% | ▼3.85% | $471.07M | |
| 109 |
|
$0.1771 | ▼0.66% | ▲3.47% | ▼4.78% | $399.88M | |
| 110 |
|
$1.66 | ▼0.35% | ▲1.17% | ▼12.67% | $394.69M | |
| 111 |
|
$1.34 | ▼0.32% | ▼1.14% | ▼3.92% | $431.87M | |
| 112 |
|
$0.4661 | ▼1.29% | ▼4.84% | ▼14.01% | $446.46M | |
| 113 |
|
$1.71 | ▼1.69% | ▼2.67% | ▲0.84% | $428.03M | |
| 114 |
|
$0.00615183 | ▼1.27% | ▼0.83% | ▼10.22% | $387.63M | |
| 115 |
|
$1.14 | ▲0.01% | ▲0.16% | ▼0.44% | $430.47M | |
| 116 |
|
$0.00448460 | ▼0.53% | ▼1.84% | ▼8.91% | $385.62M | |
| 117 |
|
$0.1189 | ▲0.03% | ▼4.90% | ▼28.38% | $277.10M | |
| 118 |
|
$0.3404 | ▲0.55% | ▼1.72% | ▼10.60% | $316.94M | |
| 119 |
|
$0.00000422 | ▼0.77% | ▲1.83% | ▼9.98% | $370.90M | |
| 120 |
|
$0.00006179 | ▼0.28% | ▲2.31% | ▼8.13% | $341.62M | |
| 121 |
|
$0.0603 | ▼0.30% | ▲4.98% | ▼59.50% | $109.94M | |
| 122 |
|
$0.5395 | ▼0.40% | ▲1.19% | ▼10.95% | $354.52M | |
| 123 |
|
$1.05 | ▲0.01% | ▲0.03% | ▲0.13% | $406.76M | |
| 124 |
|
$0.7839 | ▼1.46% | ▲5.87% | ▼14.77% | $301.83M | |
| 125 |
|
$0.0495 | ▼0.86% | ▼0.55% | ▼11.55% | $333.72M | |
| 126 |
|
$0.3968 | ▲0.04% | ▲6.21% | ▲1.32% | $371.47M | |
| 127 |
|
$0.1665 | ▼0.95% | ▼0.28% | ▼8.63% | $308.27M | |
| 128 |
|
$0.9968 | ▼0.01% | ▼0.07% | ▼0.17% | $349.00M | |
| 129 |
|
$0.1899 | ▼0.46% | ▼0.34% | ▼10.64% | $290.18M | |
| 130 |
|
$0.3478 | ▲0.04% | ▲1.41% | ▼1.08% | $322.53M | |
| 131 |
|
||||||
| 132 |
|
$0.8109 | ▼0.02% | ▼2.49% | ▲25.63% | $396.13M | |
| 133 |
|
$0.0167 | ▼0.13% | ▼0.39% | ▼4.04% | $321.64M | |
| 134 |
|
$0.1225 | ▼0.99% | ▼25.49% | ▼66.75% | $122.40M | |
| 135 |
|
$129.21 | ▲0.48% | ▲0.59% | ▲0.50% | $308.33M | |
| 136 |
|
$0.0370 | ▼0.00% | ▲10.01% | ▼2.99% | $291.58M | |
| 137 |
|
$0.1019 | ▼0.91% | ▲20.11% | ▼14.57% | $254.45M | |
| 138 |
|
$0.0962 | ▼1.22% | ▼2.09% | ▲5.00% | $250.01M | |
| 139 |
|
$107.60 | ▼0.51% | ▲2.75% | ▼0.38% | $284.04M | |
| 140 |
|
$0.4883 | ▼1.72% | ▲1.63% | ▲7.50% | $297.70M | |
| 141 |
|
$0.0422 | ▼0.58% | ▼0.62% | ▼12.97% | $220.22M | |
| 142 |
|
$0.2103 | ▼0.94% | ▼1.09% | ▼11.14% | $229.05M | |
| 143 |
|
$0.00000026 | ▼0.13% | ▼1.31% | ▼3.48% | $258.58M | |
| 144 |
|
$0.00000026 | ▼0.05% | ▲0.91% | ▼0.85% | $261.53M | |
| 145 |
|
$0.0630 | ▼0.60% | ▼1.32% | ▼15.55% | $218.79M | |
| 146 |
|
$58.52 | ▲1.98% | ▲4.76% | ▼12.04% | $221.05M | |
| 147 |
|
$0.7737 | ▼0.77% | ▲2.78% | ▼19.97% | $195.23M | |
| 148 |
|
$0.0188 | ▼0.50% | ▼0.42% | ▼11.67% | $221.96M | |
| 149 |
|
$0.00228537 | ▲0.52% | ▼2.34% | ▼6.68% | $223.86M | |
| 150 |
|
||||||
| 151 |
|
$0.00002188 | ▼0.29% | ▲1.45% | ▼15.26% | $211.23M | |
| 152 |
|
$0.0173 | ▼0.50% | ▼1.18% | ▼16.47% | $181.03M | |
| 153 |
|
$0.2321 | ▲0.12% | ▲54.85% | ▲120.25% | $473.06M | |
| 154 |
|
$1.35 | ▲2.60% | ▲8.57% | ▼7.17% | $231.39M | |
| 155 |
|
$12.55 | ▼0.04% | ▼0.04% | ▲4.33% | $251.61M | |
| 156 |
|
$0.00446362 | ▼0.39% | ▲2.27% | ▼6.49% | $220.72M | |
| 157 |
|
$0.9901 | ▲0.02% | ▼0.11% | ▼0.07% | $237.19M | |
| 158 |
|
$15.60 | ▼0.55% | ▼0.87% | ▼1.92% | $233.03M | |
| 159 |
|
$0.00226985 | ▼0.98% | ▼2.45% | ▼5.82% | $215.82M | |
| 160 |
|
$0.2513 | ▼1.02% | ▲2.35% | ▼9.92% | $211.77M | |
| 161 |
|
$0.1005 | ▼0.51% | ▼0.39% | ▼2.77% | $217.09M | |
| 162 |
|
$0.2172 | ▼0.58% | ▼1.84% | ▼8.85% | $217.35M | |
| 163 |
|
$0.00000099 | ▼0.24% | ▼2.01% | ▼6.58% | $208.11M | |
| 164 |
|
$0.2181 | ▲0.10% | ▲0.19% | ▼3.08% | $218.18M | |
| 165 |
|
$0.0292 | ▼0.77% | ▲1.32% | ▼15.82% | $190.27M | |
| 166 |
|
$1.00 | ▲0.20% | ▲0.31% | ▲0.22% | $228.79M | |
| 167 |
|
$0.0357 | ▼0.77% | ▲4.93% | ▼4.80% | $209.38M | |
| 168 |
|
$63.96 | ▼0.28% | ▼1.27% | ▼0.53% | $216.17M | |
| 169 |
|
$0.6576 | ▼1.13% | ▲1.92% | ▼15.43% | $192.07M | |
| 170 |
|
$0.0669 | ▲0.36% | ▲0.73% | ▼5.84% | $192.29M | |
| 171 |
|
||||||
| 172 |
|
$4.13 | ▼0.20% | ▼0.37% | ▼13.36% | $169.04M | |
| 173 |
|
$0.0353 | ▼0.55% | ▼4.56% | ▼21.80% | $159.48M | |
| 174 |
|
$11.21 | ▼0.41% | ▼0.96% | ▼6.08% | $196.18M | |
| 175 |
|
$0.0182 | ▼1.03% | ▲2.80% | ▼9.22% | $196.62M | |
| 176 |
|
$0.9987 | ▼0.00% | ▼0.00% | ▼0.04% | $170.82M | |
| 177 |
|
$1.00 | ▲0.00% | ▲0.00% | ▲0.00% | $202.50M | |
| 178 |
|
$0.0593 | ▼0.44% | ▼0.92% | ▼7.45% | $196.15M | |
| 179 |
|
$0.7823 | ▲2.63% | ▲3.03% | ▲10.21% | $214.67M | |
| 180 |
|
$0.9996 | ▲0.03% | ▼0.04% | ▼0.01% | $192.94M | |
| 181 |
|
$1.12 | ▲0.06% | ▲0.05% | ▲0.26% | $204.54M | |
| 182 |
|
$0.9978 | ▼0.01% | ▼0.04% | ▼0.10% | $187.08M | |
| 183 |
|
$1,898.15 | ▲0.11% | ▲0.15% | ▼11.67% | $160.79M | |
| 184 |
|
$0.00000189 | ▼0.08% | ▼0.16% | ▼23.40% | $113.35M | |
| 185 |
|
$0.8390 | ▼0.01% | ▼3.06% | ▼12.28% | $135.97M | |
| 186 |
|
$1.10 | ▲1.19% | ▲8.39% | ▼13.12% | $130.87M | |
| 187 |
|
$0.9839 | ▼0.88% | ▲0.09% | ▼7.31% | $171.08M | |
| 188 |
|
$2.03 | ▼0.30% | ▲0.34% | ▼1.10% | $173.56M | |
| 189 |
|
$1.09 | ▲0.00% | ▲0.00% | ▲0.07% | $167.51M | |
| 190 |
|
$15.78 | ▼0.10% | ▲1.26% | ▼13.96% | $152.63M | |
| 191 |
|
$1.09 | ▼0.05% | ▼0.01% | ▲0.02% | $160.86M | |
| 192 |
|
$0.3490 | ▼0.92% | ▼0.52% | ▼9.61% | $145.44M | |
| 193 |
|
$0.1401 | ▼1.04% | ▼5.24% | ▲1.02% | $163.04M | |
| 194 |
|
$0.1799 | ▼1.64% | ▲3.84% | ▲6.33% | $179.71M | |
| 195 |
|
$1.69 | ▼0.08% | ▼0.01% | ▼2.47% | $155.00M | |
| 196 |
|
$0.6258 | ▼0.11% | ▲1.57% | ▼2.53% | $167.98M | |
| 197 |
|
$1.00 | ▲0.00% | ▲0.00% | ▲0.00% | $162.50M | |
| 198 |
|
$0.1316 | ▼1.01% | ▼1.56% | ▼16.12% | $131.60M | |
| 199 |
|
$2.05 | ▼0.36% | ▼3.67% | ▼17.41% | $117.59M | |
| 200 |
|
||||||
| 201 | Polygon (MATIC) MATIC | ||||||
| 202 | Pyth Network (PYTH) PYTH | $0.0370 | ▼0.00% | ▲10.01% | ▼2.99% | $291.58M | |
| 203 | THORChain (RUNE) RUNE | $0.3850 | ▼0.11% | ▼1.39% | ▼8.94% | $130.27M | |
| 204 | Astherus USDF (USDF) USDF | $0.9968 | ▼0.01% | ▼0.04% | ▼0.11% | $112.51M | |
| 205 | Basic Attention Token (BAT) BAT | $0.0834 | ▼0.24% | ▼0.42% | ▼9.70% | $124.69M | |
| 206 | Tagger (TAG) TAG | $0.00108597 | ▼0.19% | ▲21.45% | ▲12.22% | $118.28M | |
| 207 | Wrapped Beacon ETH (WBETH) WBETH | ||||||
| 208 | Fartcoin (FARTCOIN) FARTCOIN | $0.1428 | ▼0.71% | ▲10.13% | ▲8.75% | $142.92M | |
| 209 | Decentraland (MANA) MANA | $0.0633 | ▼1.05% | ▼0.64% | ▼14.47% | $123.97M | |
| 210 | Centrifuge (CFG) CFG | ||||||
| 211 | Onyxcoin (XCN) XCN | $0.00376320 | ▲0.09% | ▼2.09% | ▼6.58% | $145.16M | |
| 212 | Convex Finance (CVX) CVX | ||||||
| 213 | Arweave (AR) AR | $1.97 | ▲0.26% | ▲7.30% | ▼2.04% | $129.33M | |
| 214 | The Sandbox (SAND) SAND | $0.0466 | ▼0.79% | ▲0.11% | ▼17.83% | $124.39M | |
| 215 | Drift Staked SOL (DSOL) DSOL | ||||||
| 216 | Ribbita by Virtuals (TIBBIR) TIBBIR | ||||||
| 217 | Pieverse (PIEVERSE) PIEVERSE | $0.7823 | ▲2.63% | ▲3.03% | ▲10.21% | $214.67M | |
| 217 | Sentient (SENT) SENT | ||||||
| 218 | Shuffle (SHFL) SHFL | $0.2789 | ▼0.47% | ▼3.82% | ▼2.14% | $118.58M | |
| 219 | SyrupUSDC (SYRUPUSDC) SYRUPUSDC | ||||||
| 221 | Reserve Protocol ETH Plus (ETH+) ETH+ | ||||||
| 222 | SafePal Token (SFP) SFP | ||||||
| 223 | edgeX (EDGE) EDGE | ||||||
| 224 | The Vault Staked SOL (VSOL) VSOL | ||||||
| 225 | Maker (MKR) MKR | ||||||
| 226 | Block Street (BSB) BSB | ||||||
| 227 | crvUSD (CRVUSD) CRVUSD | $0.9987 | ▼0.00% | ▼0.00% | ▼0.04% | $170.82M | |
| 228 | Vision (VSN) VSN | $0.0317 | ▼0.39% | ▲1.82% | ▼2.87% | $118.74M | |
| 229 | GoMining Token (GOMINING) GOMINING | $0.2796 | ▼0.16% | ▼0.35% | ▼3.85% | $112.99M | |
| 230 | Vaulta (A) A | ||||||
| 231 | KAITO (KAITO) KAITO | $0.5795 | ▲0.39% | ▼1.80% | ▲21.43% | $139.92M | |
| 232 | Cheems (CHEEMS) CHEEMS | ||||||
| 233 | eCash (XEC) XEC | ||||||
| 234 | Cash (CASH) CASH | $0.9993 | ▲0.01% | ▲0.02% | ▲0.02% | $120.35M | |
| 235 | LayerZero (ZRO) ZRO | $0.7737 | ▼0.77% | ▲2.78% | ▼19.97% | $195.23M | |
| 236 | Astherus Staked BNB (ASBNB) ASBNB | ||||||
| 237 | ONyc (ONYC) ONYC | $1.12 | ▲0.06% | ▲0.05% | ▲0.26% | $204.54M | |
| 238 | Story (IP) IP | ||||||
| 239 | Golem (GLM) GLM | ||||||
| 240 | YZY (YZY) YZY | ||||||
| 241 | AWE Network (AWE) AWE | ||||||
| 242 | Zeebu (ZBU) ZBU | ||||||
| 243 | Banana For Scale (BANANA) BANANA | ||||||
| 245 | TAC Protocol (TAC) TAC | $0.0514 | ▼4.23% | ▲141.55% | ▲165.84% | $240.11M | |
| 245 | Bitway (BTW) BTW | $0.0502 | ▼2.48% | ▼17.68% | ▼54.63% | $110.54M | |
| 246 | 1INCH (1INCH) 1INCH | ||||||
| 247 | AB (prev. Newton) (AB) AB | ||||||
| 248 | Home (HOME) HOME | ||||||
| 249 | BitMart Token (BMX) BMX | $0.3244 | ▼0.50% | ▼1.38% | ▲0.53% | $110.06M | |
| 250 | o1.exchange (O) O | ||||||
| 251 | Sonic (S) S | ||||||
| 252 | Rollbit Coin (RLB) RLB | ||||||
| 253 | Gala (GALA) GALA | $0.00227391 | ▼0.81% | ▲0.65% | ▼14.27% | $110.23M | |
| 254 | PulseX (PLSX) PLSX | ||||||
| 255 | Pulsechain (PLS) PLS | ||||||
| 256 | Unity USD (UUSD) UUSD | ||||||
| 257 | MetaMask USD (MUSD) MUSD | ||||||
| 258 | Tokenize Xchange (TKX) TKX | ||||||
| 259 | Smilek to the Bank (SMILEK) SMILEK | ||||||
| 260 | ApeCoin (APE) APE | $0.1387 | ▲1.33% | ▲0.23% | ▼0.70% | $138.67M | |
| 262 | WEMIX Token (WEMIX) WEMIX | $0.2362 | ▲0.04% | ▲0.87% | ▲1.87% | $109.23M | |
| 262 | Aethir (ATH) ATH | ||||||
| 263 | Sanctum Staked SOL (SCNSOL) SCNSOL | ||||||
| 264 | Litentry (LIT) LIT | $1.71 | ▼1.69% | ▼2.67% | ▲0.84% | $428.03M | |
| 265 | Origin Ether (OETH) OETH | ||||||
| 266 | River (RIVER) RIVER | ||||||
| 267 | Magma Finance (MAGMA) MAGMA | ||||||
| 268 | ViciCoin (VCNT) VCNT | ||||||
| 269 | Fantom (FTM) FTM | ||||||
| 270 | Four (FORM) FORM | ||||||
| 271 | Renzo Restaked ETH (EZETH) EZETH | ||||||
| 272 | Bybit Staked SOL (BBSOL) BBSOL | ||||||
| 273 | BitDCA (BDCA) BDCA | ||||||
| 274 | Livepeer (LPT) LPT | ||||||
| 275 | MultiversX (Elrond) (EGLD) EGLD | ||||||
| 276 | DYDX Chain (DYDX) DYDX | $0.1635 | ▼0.09% | ▲8.83% | ▲24.59% | $137.98M | |
| 277 | Reserve Rights (RSR) RSR | ||||||
| 278 | Synthetix Network (SNX) SNX | ||||||
| 279 | UXLINK (UXLINK) UXLINK | ||||||
| 280 | AI Rig Complex (ARC) ARC | ||||||
| 281 | Frax USD (FRXUSD) FRXUSD | $0.9997 | ▲0.00% | ▼0.01% | ▼0.02% | $114.18M | |
| 282 | Undeads Games (UDS) UDS | ||||||
| 283 | UltimaEcosystem (ULTIMA) ULTIMA | $1,898.15 | ▲0.11% | ▲0.15% | ▼11.67% | $160.79M | |
| 284 | staked USD1+ (SUSD1+) SUSD1+ | ||||||
| 285 | HEX (Pulsechain) (HEX) HEX | ||||||
| 286 | Beam Token (BEAM) BEAM | ||||||
| 286 | Binance-Peg SOL (SOL) SOL | $73.45 | ▼0.18% | ▲2.26% | ▼0.93% | $42.70B | |
| 288 | BNB Attestation Service (BAS) BAS | $0.0495 | ▲0.12% | ▲16.14% | ▲65.25% | $123.56M | |
| 289 | Siren (SIREN) SIREN | ||||||
| 290 | Lista USD (LISUSD) LISUSD | ||||||
| 291 | Useless Coin (USELESS) USELESS | ||||||
| 292 | Qtum (QTUM) QTUM | ||||||
| 293 | Arkham (ARKM) ARKM | ||||||
| 294 | 0x (ZRX) ZRX | ||||||
| 295 | Pharos (PROS) PROS | ||||||
| 295 | Gas (GAS) GAS | ||||||
| 297 | ZIGChain (ZIG) ZIG | ||||||
| 298 | MAG7.ssi (MAG7.SSI) MAG7.SSI | ||||||
| 299 | AIOZ Network (AIOZ) AIOZ | ||||||
| 300 | Comedian (BAN) BAN |
Tipp: Klicken Sie auf eine Spaltenüberschrift zum Sortieren oder tippen Sie ins Suchfeld, um nach Name oder Symbol zu filtern. Klicken Sie auf einen Coin, um seine vollständige Preisseite und Charts zu öffnen.
Top-Bewegungen heute
Die größten 24-Stunden-Gewinner und -Verlierer unter den Coins, die wir erfassen. Große Tagesbewegungen folgen oft auf Nachrichten, Listings oder Stimmungsänderungen — nutzen Sie sie als Ausgangspunkt für Recherchen, nicht als eigenständiges Signal.
Top-Bewegungen (24h)
Marktstimmung: der Fear & Greed Index
Ein schneller Blick auf die Stimmung am Kryptomarkt, bewertet von 0 (extreme Angst) bis 100 (extreme Gier).
Fear & Greed Index
The Fear & Greed Index blends volatility, trading momentum, volume and social signals into one number. Periods of extreme fear can mark moments when prices have fallen faster than fundamentals, while extreme greed can flag froth — though sentiment can stay stretched far longer than expected.
Treat it as context, not a trade signal. Pair the gauge with the live table above and the definitions in our crypto glossary to understand what is actually driving a move.
So lesen Sie diese Krypto-Kurse
Jede Spalte in der Tabelle oben beantwortet eine andere Frage. Hier erfahren Sie, was jede bedeutet und warum sie wichtig ist.
| Spalte | Was sie zeigt | Warum es wichtig ist |
|---|---|---|
| Kurs | Der zuletzt gehandelte Wert einer Coin in US-Dollar. | Die wichtigste Zahl, die für sich allein jedoch nichts über die Größe eines Projekts aussagt. |
| 1h / 24h / 7d | Prozentuale Veränderung in der letzten Stunde, am letzten Tag und in der letzten Woche. | Kurze Zeitfenster zeigen Momentum und Volatilität; die 7-Tage-Ansicht glättet das Rauschen. |
| Marktkapitalisierung | Kurs multipliziert mit dem Umlaufangebot. | Die fairste Methode, Coins nach ihrer tatsächlichen Größe zu sortieren und zu vergleichen. |
| Letzte 7 T | Eine Sparkline des Kursverlaufs der letzten Woche. | Richtung und Verlauf des Trends auf einen Blick, ohne die Zahlen zu lesen. |
A common mistake is judging a coin by its unit price alone. A token priced at a few cents can be far larger than one priced in the hundreds of dollars, because supply differs enormously between projects. That is exactly why market capitalisation — not price — drives the default ranking in the table. For deeper definitions of terms like circulating supply, liquidity and volatility, see our glossary.
Krypto-Marktkapitalisierung verstehen
Die Marktkapitalisierung gruppiert Coins in grobe Größenklassen. Größere Caps sind tendenziell stabiler; kleinere Caps können sich stärker und schneller bewegen, in beide Richtungen.
| Stufe | Typische Marktkapitalisierung | Charakter | Von uns verfolgte Coins |
|---|---|---|---|
| Large-Cap | $10B und mehr | Etabliert, höhere Liquidität, geringere relative Volatilität | 13 |
| Mid-Cap | $1B – $10B | Wachsende Projekte im Gleichgewicht von Risiko und Potenzial | 51 |
| Small-Cap | $100M – $1B | Höheres Risiko, geringere Liquidität, stärkere Schwankungen | 186 |
| Micro-Cap | Unter $100M | Spekulativ; kleine Trades können den Kurs stark bewegen | 0 |
Worked example: Bitcoin (BTC) currently trades around $59,665.00, with a market cap of $1.20T (about 55.7% of the entire crypto market). That dominance figure is one of the quickest ways to gauge whether capital is rotating toward Bitcoin or out into Ethereum and smaller altcoins.
Kostenlose Tools für mehr Tiefe
Verwandle die obigen Daten in Entscheidungen mit unseren kostenlosen Rechnern und Referenzen ohne Anmeldung.
Krypto-Tools
Währungsrechner, Gewinn-/Verlust- und Dollar-Cost-Averaging-Rechner sowie der Live-Fear-&-Greed-Index.
Tools durchsuchen →Krypto-Glossar
Verständliche Definitionen von Marktkapitalisierung, Liquidität, Staking, Gas-Gebühren und dem übrigen Fachjargon.
Glossar öffnen →Marktnachrichten
Die Berichterstattung und Analyse hinter den Bewegungen, die du in der Tabelle siehst – aktualisiert, sobald sich der Markt verändert.
Marktnachrichten lesen →Wie TBN Express Marktdaten bezieht
We aggregate prices, market capitalisation and volume from established market-data APIs, with an automatic fallback to a second provider when the primary source is unavailable. Sentiment data for the Fear & Greed Index comes from a public index. Figures are cached briefly for speed and refreshed throughout the day.
Our integrity rule is simple: real data or nothing. When a value can't be retrieved, the page leaves the space empty rather than showing a stale placeholder or an estimate. Read the full details in our methodology, and how we work in our editorial policy.
Not financial advice. Everything here is for general information only. Crypto markets are volatile and you can lose money — always do your own research before making any decision.
Häufig gestellte Fragen
How often do the cryptocurrency prices on this page update?
Where does TBN Express get its market data?
What is cryptocurrency market capitalisation?
What does the Fear & Greed Index measure?
What is the difference between 24-hour volume and market cap?
Is the information on this page financial advice?
Neuestes von TBN Express
Aktuelle Krypto-News, Ratgeber und Analysen aus der Redaktion.
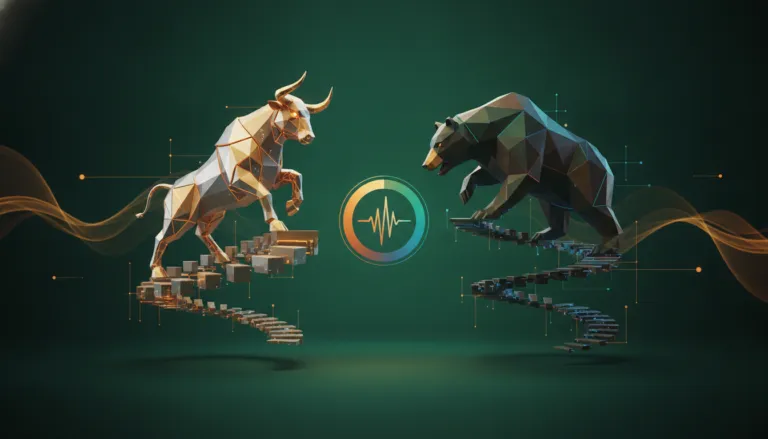 Bullen- und Bärenmärkte: Krypto-Zyklen erklärt
 Was ist eine Seed-Phrase? Und wie man sie sicher aufbewahrt
 CEX vs. DEX: Zentralisierte und dezentrale Börsen erklärt
 Was ist eine DAO? Dezentrale autonome Organisationen erklärt
Newsletter
Den Märkten einen Schritt voraus
Weekly crypto research & market intelligence from the TBN Express newsroom — straight to your inbox.
Market data is provided for informational purposes only and may be delayed. Nothing here is investment advice. See our methodology for how we source and present these figures.